Ethereum (ETH), the second-largest cryptocurrency by market capitalization, has experienced a dramatic price decline, reaching a two-year low of $1,411 as of April 8, 2025. This sharp downturn represents a staggering 65% drop from its December 2024 highs, leaving investors and market analysts scrambling to understand the implications of this significant price movement.
Market Factors Behind the Crash
Several key factors have contributed to Ethereum’s precipitous price decline:
Macroeconomic Pressures
Fresh trade tensions, including aggressive tariff announcements from President Donald Trump, have sent ripples through both traditional and cryptocurrency markets. These geopolitical developments have increased investor uncertainty and risk aversion, leading to a sell-off in various asset classes, including cryptocurrencies.
Technical Breakdown
ETH’s price has broken down from a long-term ascending parallel channel, suggesting that the recent price increase was likely part of a corrective wave. This technical analysis indicates that Ethereum may be entering the final portion of its correction, potentially setting the stage for further downside in the short term.
Massive Liquidations
The market has witnessed substantial liquidations, including a staggering $106 million liquidation of 67,570 ETH on Maker over the weekend. Additionally, an investor panic-sold 14,014 ETH (approximately $22 million) in a single evening, reflecting the heightened fear and uncertainty in the crypto space.
Price Analysis and Support Levels
The current price level of $1,411 represents a 763-day low for Ethereum. This places ETH dangerously close to its previous bear market low of $881, raising concerns about a potential further downside.
Critical Support Zone
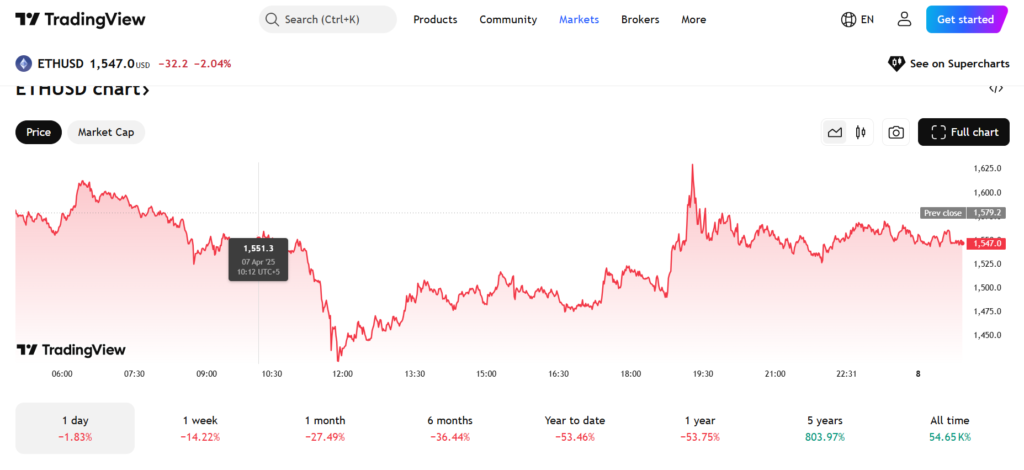
Ethereum is approaching a critical support zone around $1,520 to $1,540, which has previously held strong. If this level fails to hold, the next major downside target could be around $1,400.
RSI Indicator
The weekly Relative Strength Index (RSI) is currently at 30, nearly reaching oversold territory. This reading is noteworthy as previous market bottoms reached RSI levels of 29 and 26, suggesting that ETH may be nearing a bottom.
Market Sentiment and Future Outlook
Despite the sharp decline, some analysts see potential for a reversal:
Oversold Conditions
The RSI entering oversold territory could indicate a potential short-term bounce, although it doesn’t guarantee a market bottom.
Long-term Outlook
Some experts believe this could mark the end of Ethereum’s long-term correction, potentially setting the stage for a future recovery.
However, derivatives metrics indicate that traders remain far from bullish, with little confidence in a strong recovery in the near term. The Ether options market shows a delta skew of 7%, suggesting that risk-aversion sentiment remains strong among whales and market makers.
As Ethereum grapples with this significant price drop, investors and analysts alike are closely monitoring market indicators for signs of a potential bottom or further decline. The coming weeks will be crucial in determining whether ETH can find support at current levels or if it will test lower price points.